 |
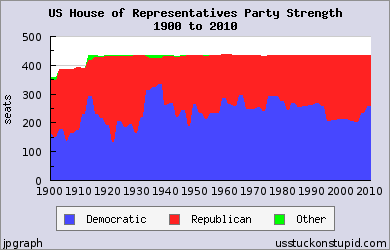
US House of Representatives Party Strength 1900-2010
Click to see or download numbers. Click to change chart
If you’d like to create your own custom chart, you should
use the table above to make your selections.
back to chart |back to table | back to top Copy and Paste: Here is the dataset you have just charted. The table also includes
nominal or chained GDP for each year charted. If you’d like
the data for analysis, just copy
the tab-delimited text in the textbox below (click cursor in text box, then
press ctrl-A then press ctrl-C) and paste
it into your spreadsheet. back to chart |back to table | back to top Below is a formatted version of the dataset displayed in the chart.
Included is a column of nominal or chained GDP for each year charted.Warning: Switching to line chart
![]()
Years 1900 to 2010Year Democrats Republicans Other 1900 163 185 9 1901 151 197 9 1902 151 197 9 1903 178 208 0 1904 178 208 0 1905 136 250 0 1906 136 250 0 1907 164 222 0 1908 164 222 0 1909 172 219 0 1910 172 219 0 1911 228 161 1 1912 228 161 1 1913 291 127 17 1914 291 127 17 1915 230 196 9 1916 230 196 9 1917 216 210 6 1918 216 210 6 1919 190 240 3 1920 190 240 3 1921 131 301 1 1922 131 301 1 1923 205 225 5 1924 205 225 5 1925 183 247 4 1926 183 247 4 1927 195 237 3 1928 195 237 3 1929 164 270 1 1930 164 270 1 1931 217 217 1 1932 221 213 1 1933 313 117 5 1934 312 112 11 1935 322 103 10 1936 322 103 10 1937 334 88 13 1938 334 88 13 1939 262 169 4 1940 262 169 4 1941 268 162 5 1942 268 162 5 1943 218 208 4 1944 218 208 4 1945 242 190 2 1946 242 190 2 1947 188 245 1 1948 188 245 1 1949 263 171 1 1950 263 171 1 1951 234 199 1 1952 234 199 1 1953 211 221 1 1954 211 221 1 1955 232 203 0 1956 232 203 0 1957 233 200 0 1958 233 200 0 1959 283 153 0 1960 283 153 0 1961 263 174 0 1962 263 174 0 1963 258 177 0 1964 258 177 0 1965 295 140 0 1966 295 140 0 1967 247 187 0 1968 247 187 0 1969 245 189 0 1970 245 189 0 1971 254 180 0 1972 254 180 0 1973 239 192 1 1974 239 192 1 1975 291 144 0 1976 291 144 0 1977 292 143 0 1978 292 143 0 1979 276 157 0 1980 276 157 0 1981 243 192 0 1982 243 192 0 1983 269 165 0 1984 269 165 0 1985 252 182 0 1986 252 182 0 1987 258 177 0 1988 258 177 0 1989 259 174 0 1990 259 174 0 1991 267 167 1 1992 267 167 1 1993 258 176 1 1994 258 176 1 1995 204 230 0 1996 204 230 0 1997 207 227 0 1998 207 227 0 1999 212 222 1 2000 212 222 1 2001 212 221 2 2002 212 221 2 2003 204 229 0 2004 204 229 0 2005 202 232 0 2006 202 232 0 2007 233 202 0 2008 233 202 0 2009 257 178 0 2010 257 178 0
1929-1939: “A Decade that will live — in stupidity.”
Why Stuck on Stupid?
Seventy years ago the leaders of both US political parties turned away from the policies that had created an economic powerhouse we call the Roaring Twenties. For ten long years Americans suffered through wrenching economic dislocations: deflation, inflation, a four-year economic contraction, endless unemployment, mindless political experiments, and ruthless attacks on businessmen for political gain as their leaders stayed Stuck on Stupid.
Today, after a twenty-five year economic boom, Americans are once more faced with a political elite that wants to monkey with success. It wants to raise tax rates. It wants to restrict trade. It wants to increase government power.
It’s time to look back and remind ourselves how it came to be, starting in 1929, that America got itself Stuck on Stupid. Otherwise it could happen again.
— Christopher Chantrill

> archive
Warning: fopen(sitemap.xml): failed to open stream: Permission denied in /home/ubuntu/sos/googsitemap_sos.php on line 96
Warning: fwrite() expects parameter 1 to be resource, boolean given in /home/ubuntu/sos/googsitemap_sos.php on line 97
Warning: fclose() expects parameter 1 to be resource, boolean given in /home/ubuntu/sos/googsitemap_sos.php on line 98
sitemap updated
